Stock futures climbed on Wednesday, driven by strong performances from Salesforce and Marvell Technology, following upbeat quarterly earnings. Futures tied to the Dow Jones Industrial Average rose by 215 points (0.5%), while S&P 500 futures gained 0.3%, and Nasdaq-100 futures advanced by 0.7%.
Salesforce surged 12% after reporting fiscal third-quarter revenue that exceeded expectations, showcasing robust demand in the enterprise software sector. Meanwhile, chipmaker Marvell jumped 14% after surpassing earnings estimates and providing optimistic fourth-quarter guidance, indicating resilience in the semiconductor industry.
This movement follows a mixed session on Wall Street, where the S&P 500 and Nasdaq closed with small gains, while the Dow dipped slightly. The broader market has experienced a modest start to December, contrasting with November’s robust rally, but analysts anticipate a resurgence in momentum. LPL Financial’s George Smith pointed out that December historically sees strong market performance, particularly in the latter half of the month.
However, economic data introduced some caution. ADP’s report revealed that private payrolls grew by just 146,000 in November, missing estimates of 163,000. This signals potential softness in the labor market, with investors now awaiting Friday’s November jobs report for further clarity.
S&P 500 Index Chart Analysis
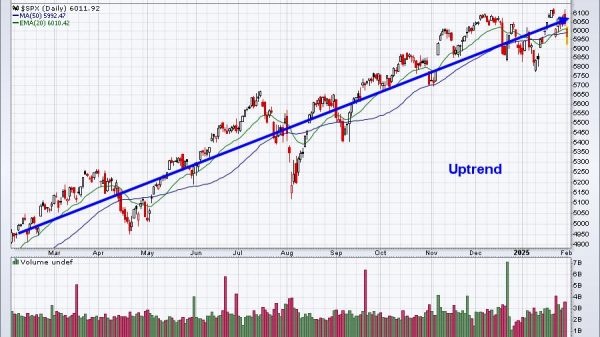
Based on the provided stock chart, which appears to be a 15-minute candlestick chart for the S&P 500 Index, here’s a brief analysis:
The chart shows a clear upward trend, with higher highs and higher lows indicating bullish momentum over the analyzed period. The index has steadily climbed from a low of approximately 5,855 to a recent high of 6,053.58, suggesting strong buying interest.
Key resistance is observed near 6,050-6,053 levels, as the price has struggled to break above this zone in the most recent sessions. If the index breaches this level with strong volume, it could lead to further upward movement. Conversely, failure to break out may lead to a pullback, with potential support around the 6,000 psychological level and 5,980, where consolidation occurred previously.
The candlestick patterns show relatively small wicks, indicating limited volatility, which could imply steady market confidence. However, the bullish rally could be overextended, warranting caution for traders, especially if any negative catalysts emerge.
In summary, the short-term trend is bullish, but traders should monitor resistance levels and volume for signs of a breakout or reversal. It’s also essential to watch broader market factors, as indices are often influenced by macroeconomic data and sentiment.
The post S&P 500 climbed 0.3%, and Nasdaq-100 futures jumped 0.7% appeared first on FinanceBrokerage.


